Project Summary
FPD Beverage Company suffers from outdated, disconnected systems causing poor forecasting and customer dissatisfaction. This project proposes building a QlikSense-based real-time analytics dashboard to enhance decision-making, improve delivery, and protect $350M in annual revenue.
Budget: $250,000 (plus 10% contingency)
Timeline: July 1 – Dec 31 (6 months)
Project Scope & Objectives
Objective
Develop a secure, real-time dashboard using QlikSense AI tools to visualize:
- Product sales
- Packaging performance
- Delivery metrics by customer
Deliverables
- Cloud dashboard (mobile/desktop)
- AI-driven analytics integration
- User training (QlikSense)
- Technical documentation
- Risk management and execution plan
Work Breakdown & Budget
- WBS includes dashboard UI design, data cleansing, analytics model development, and UAT
- Estimation uses hybrid (top-down + bottom-up) approach
- Example task:
- Build analytics models: 219.6 hrs @ $110/hr = $24,156
- Configure Qlik dashboard: 274.5 hrs = $32,195
Total Estimated Cost: $249,765
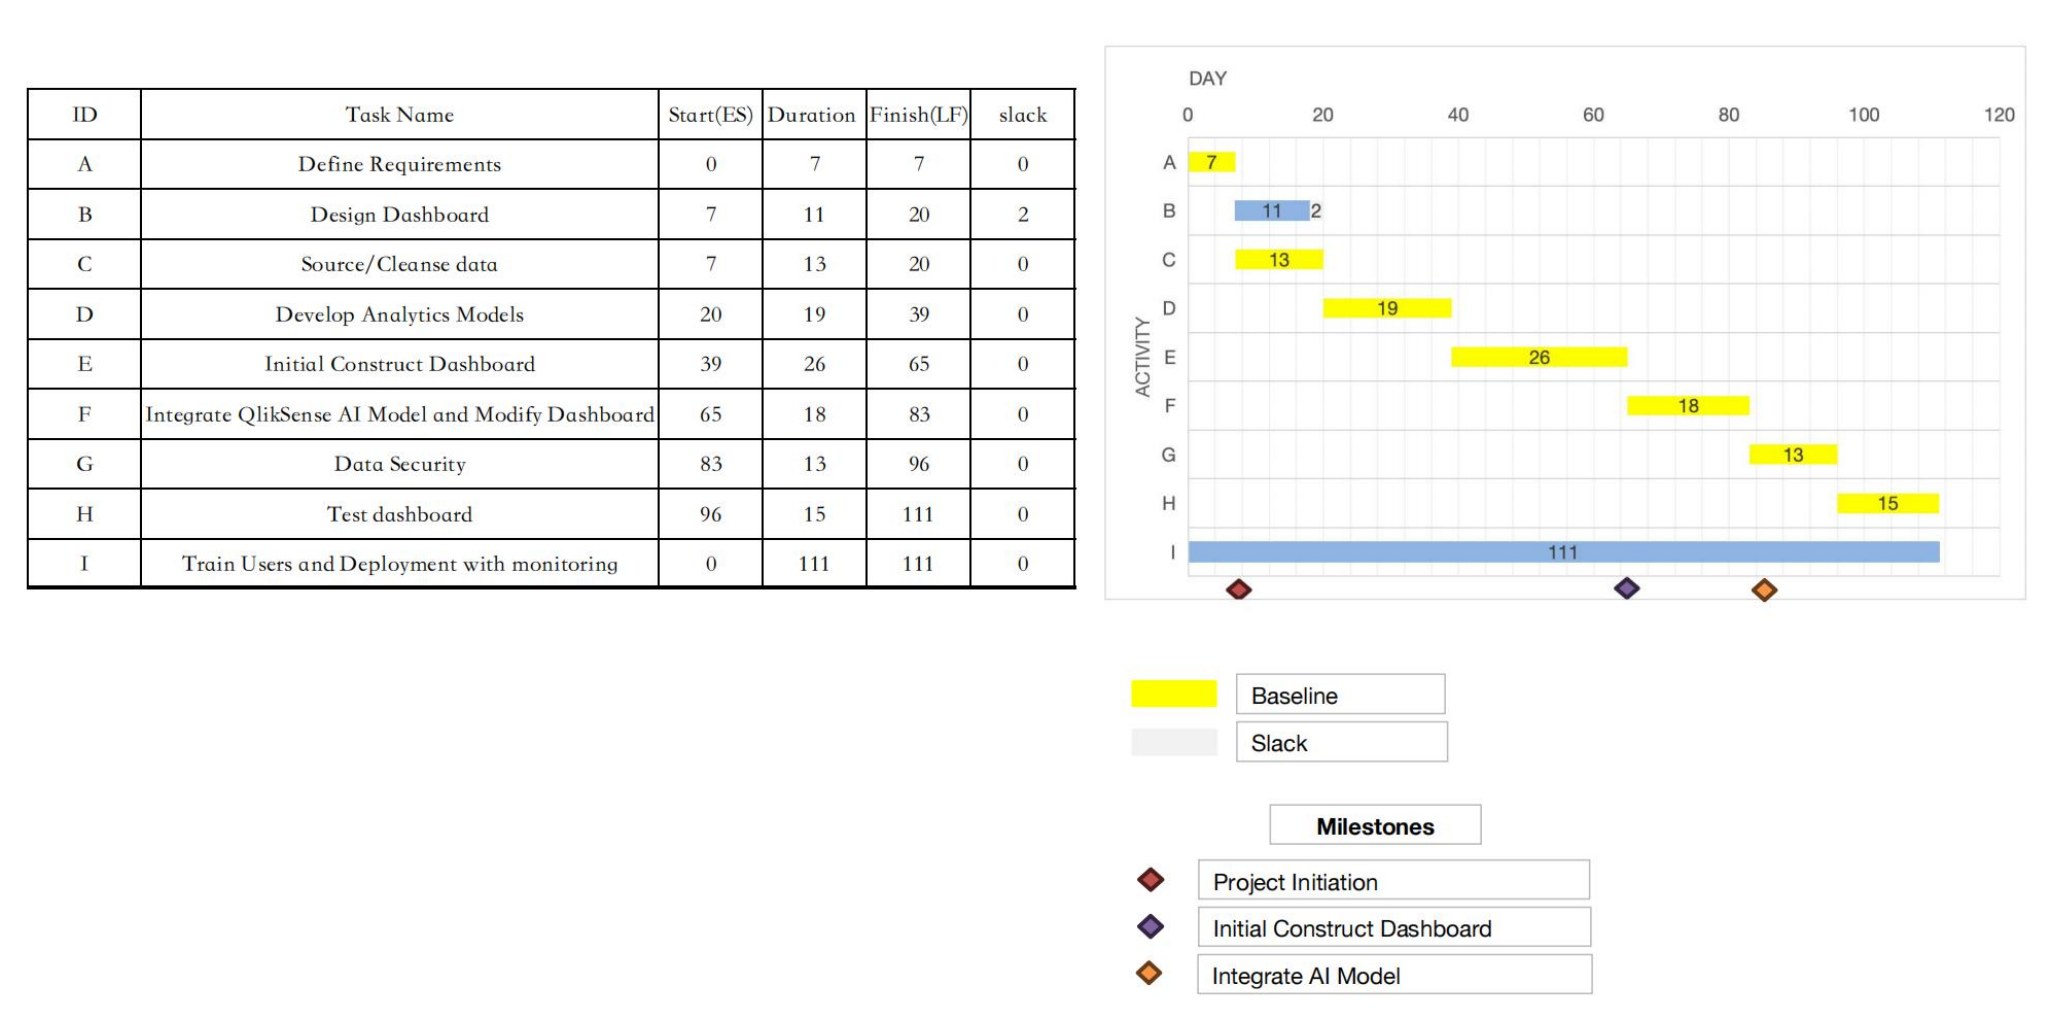
WBS, Gantt, AON diagrams all align
Milestones
| Milestone | Due |
|---|---|
| Team formation & requirements | 07/31 |
| QlikSense AI Training | 08/31 |
| Dashboard Design | 09/30 |
| Prototype Ready | 10/31 |
| User Testing | 11/30 |
| Full Launch | 12/31 |
Communication Strategy
| Audience | Frequency | Channel |
|---|---|---|
| Sponsor | Bi-weekly | Reports, Email |
| EOC | Monthly | Meetings |
| Team | Weekly | Slack, Standups |
| End Users | Monthly | Reports, Feedback Sessions |
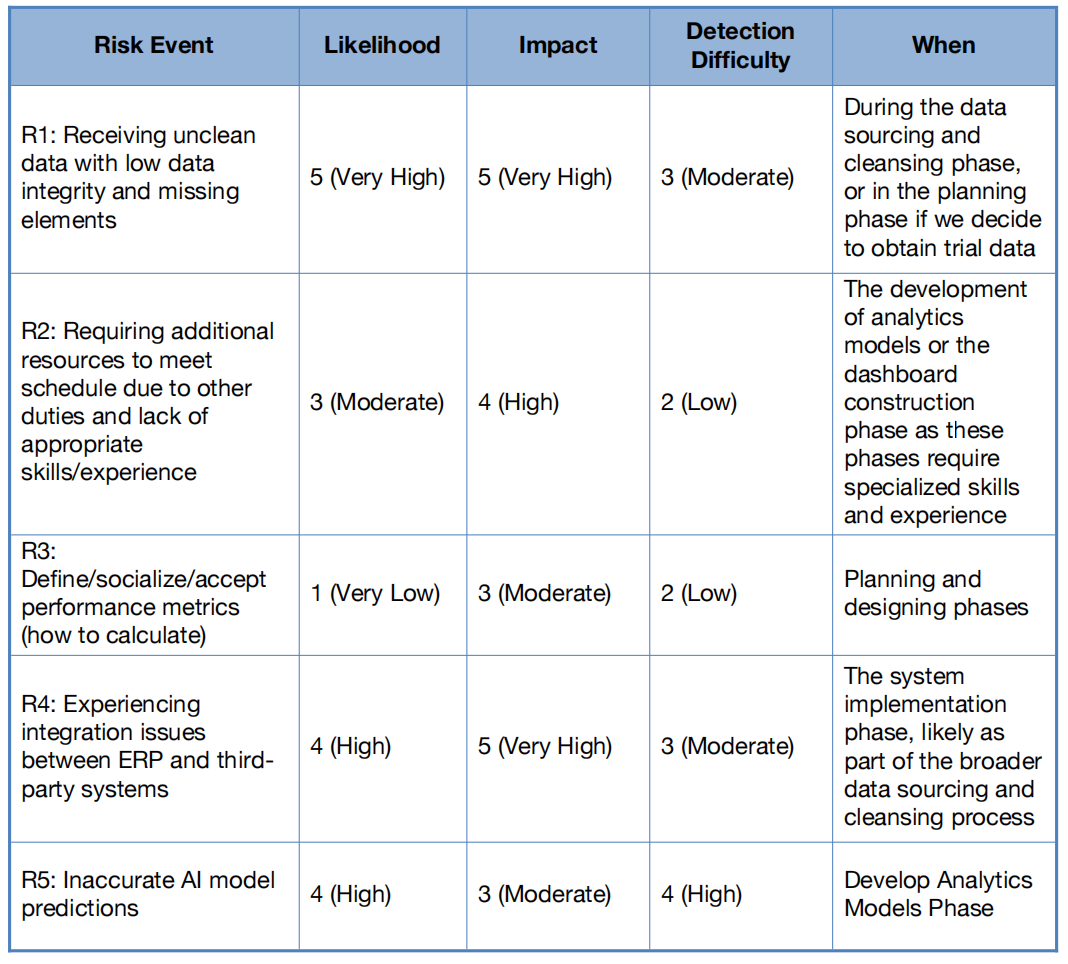
Risk Management
- Major Risks: Low data quality (R1), ERP integration (R4)
- Medium Risks: Model accuracy (R5), resource shortages (R2)
- Mitigations include: fallback data cleaning, cross-functional task force, retraining, and modular AI deployment
Risk rating: Medium-High
ROI tied to successful integration and model output
Feasibility & Success Metrics
Project success measured by:
- On-time, on-budget delivery
- Accurate, AI-powered dashboards
- Positive user adoption and stakeholder feedback
- Reduction in missed shipments & better performance predictability
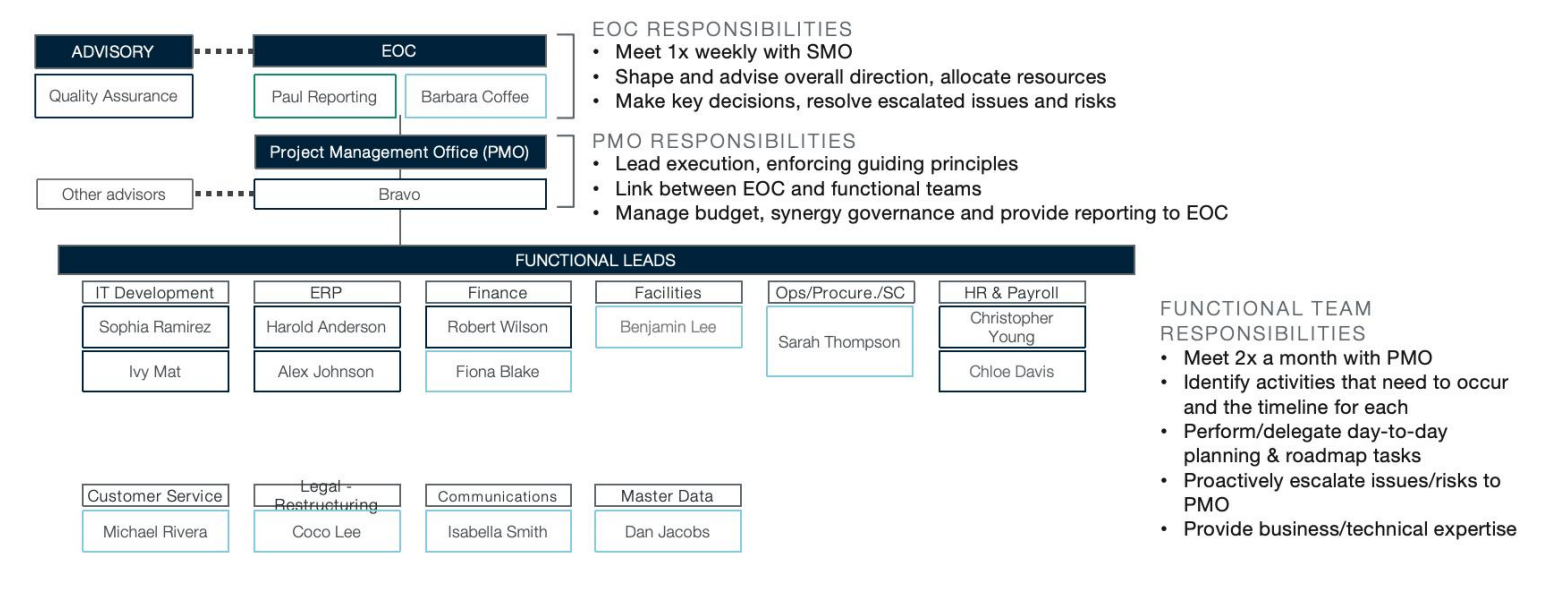
Responsibility Matrix (RACI)
| Task | PM | IT | ERP Analyst | DB Analyst | Supply Chain | Sales |
|---|---|---|---|---|---|---|
| Requirements | R | S | S | S | S | R |
| Dashboard | R | S | S | S | S | R |
| Data Prep | R | S | R | R | S | S |
| Analytics | R | S | S | R | S | S |
| UAT & Go-Live | R | S | S | S | S | R |
📎 Full Project Plan (PDF): Download Here